Analysis of Candy Ranking using Python

Who doesn't like candies!? While savouring some of these delectable treats, I decided to analyze their popularity based on a variety of factors such as chocolate content, presence of caramel and nougat using the Plotly library in Python.
About the Dataset:
I have used the following dataset to analyze candies :
https://www.kaggle.com/datasets/fivethirtyeight/fivethirtyeight-candy-power-ranking-dataset
The columns present in the dataset are as follows:
competitorname: name of the candy
chocolate: gives 1 if chocolate is present otherwise 0
fruity: gives 1 if the candy contains fruit otherwise 0
caramel: gives 1 if candy contains caramel or else 0
peanutyalmondy : gives 1 if candy contains peanut/almond or else 0
nougat: gives 1 if candy contains nougat otherwise 0
crispedricewafer: gives 1 if candy contains crisped rice/wafer/cookie component or else 0
hard: gives 1 if candy is hard otherwise 0
bar: gives 1 if candy is in bar form otherwise gives 0
pluribus: gives 1 if candy comes along with other candies as a pack and 0 if the candy is available as a single unit.
sugarpercent : gives the percentile of sugar in which the candy falls under
pricepercent: gives the unit price percentile in which the candy falls under
winpercent: gives the overall win percentage of the candy
I have used Google Colab to carry out this analysis.
Importing and Installing the desired libraries:
import pandas as pd
import io
!pip install plotly
import plotly.express as px
Importing CSV file in Google Colab:
I have downloaded the dataset on my local computer. The following code snippet needs to be executed to upload the dataset.
from google.colab import files
uploaded=files.upload()
After choosing the file, the next snippet is executed :
df=pd.read_csv(io.BytesIO(uploaded['candy-data.csv']))
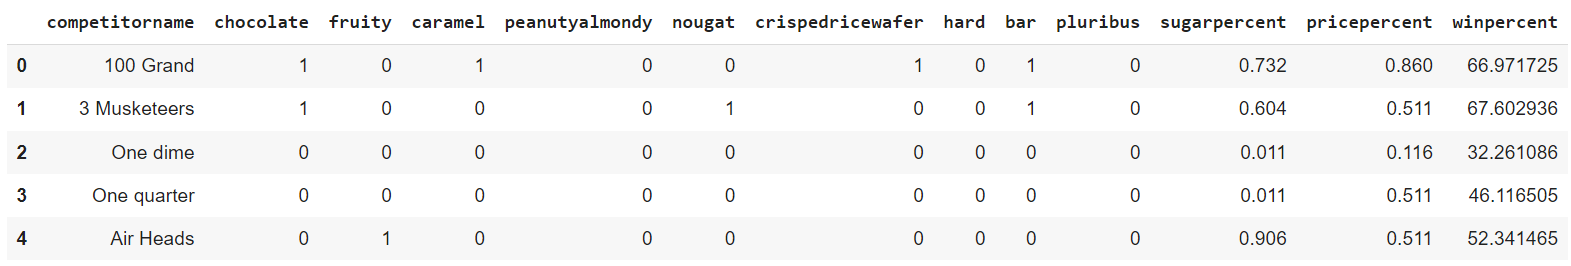
To check if the dataset is successfully imported, the following line of code is written.
df.head()
The output will be:
Data Cleaning:
Checking for null values in the dataset:
df.isnull().sum()
The output is:
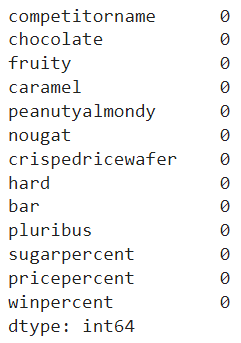
No column in the dataset contains null values.
Checking for duplicate values in the dataset:
df.duplicated().sum()
The output is 0. Hence there are no duplicate values present in the dataset.
Replacing values in certain columns:
In columns such as chocolate, caramel, nougat and so on, the presence of content is indicated using 0's and 1's. These values may lead to confusion in the analysis later on. The following functions are written to convert 0's and 1's into appropriate strings.
def choco_convert(x):
  if(x==0):
    return "no chocolate"
  else:
    return "contains chocolate"
def fruity_convert(x):
  if(x==0):
    return "no fruit"
  else:
    return "contains fruit"
def caramel_convert(x):
  if(x==0):
    return "no caramel"
  else:
    return "contains caramel"
def peanutalmond_convert(x):
  if(x==0):
    return "no peanut/almond"
  else:
    return "contains peanut/almond"
def nougat_convert(x):
  if(x==0):
    return "no nougat"
  else:
    return "contains nougat"
def crispedricewafer_convert(x):
  if(x==0):
    return "no crispedrice/wafer"
  else:
    return "contains crispedrice/wafer"
def hard_convert(x):
  if(x==0):
    return "soft candy"
  else:
    return "hard candy"
def bar_convert(x):
  if(x==0):
    return "non-bar candy"
  else:
    return "bar candy"
def pluribus_convert(x):
  if(x==0):
    return "single"
  else:
    return "pack"
The functions are now applied to the desired columns to achieve a more comprehensive dataset.
df['chocolate']=df['chocolate'].apply(choco_convert)
df['fruity']=df['fruity'].apply(fruity_convert)
df['caramel']=df['caramel'].apply(caramel_convert)
df['peanutyalmondy']=df['peanutyalmondy'].apply(peanutalmond_convert)
df['nougat']=df['nougat'].apply(nougat_convert)
df['crispedricewafer']=df['crispedricewafer'].apply(crispedricewafer_convert)
df['hard']=df['hard'].apply(hard_convert)
df['bar']=df['bar'].apply(bar_convert)
df['pluribus']=df['pluribus'].apply(pluribus_convert)
In order to view the changes made to the dataset, the snippet provided below is executed :
df.head()
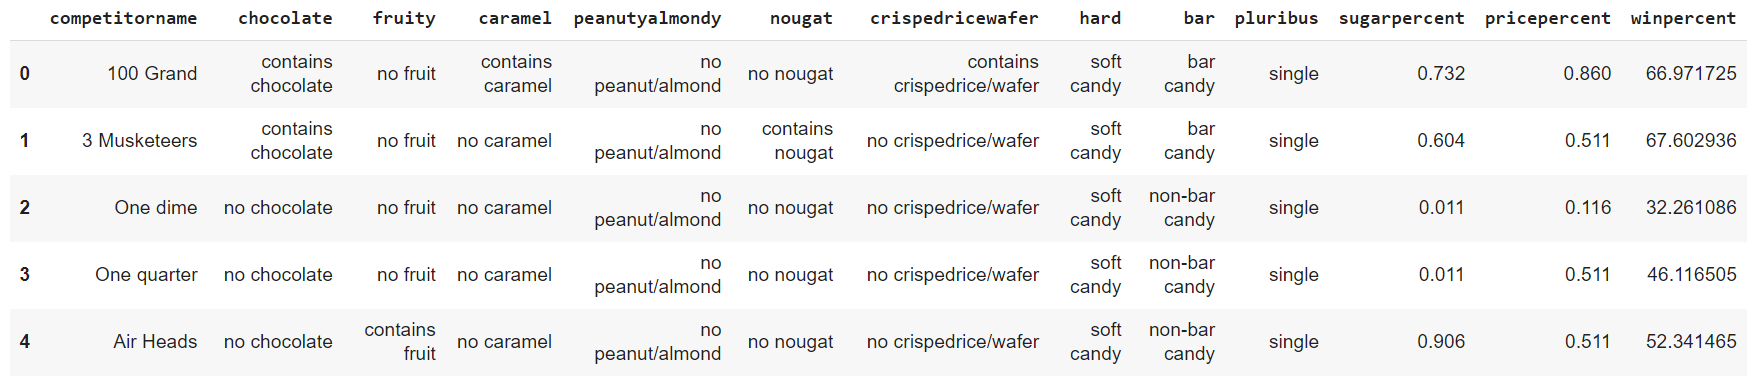
The dataset now provides a meaningful picture of all parameters under consideration.
Analysing the Dataset using Plotly:
I have made use of the Plotly library to gather valuable insights from the dataset.
Determining the top 10 candies with the highest win percentage:
df=df.sort_values(by=['winpercent'],ascending=False)
fig=px.bar(df.head(10),y="competitorname",x="winpercent",orientation="h",title="Top 10 Candies with Highest Win Percentage",color_discrete_sequence=['coral'])
fig.show()
The following graph is obtained after executing the above statements:
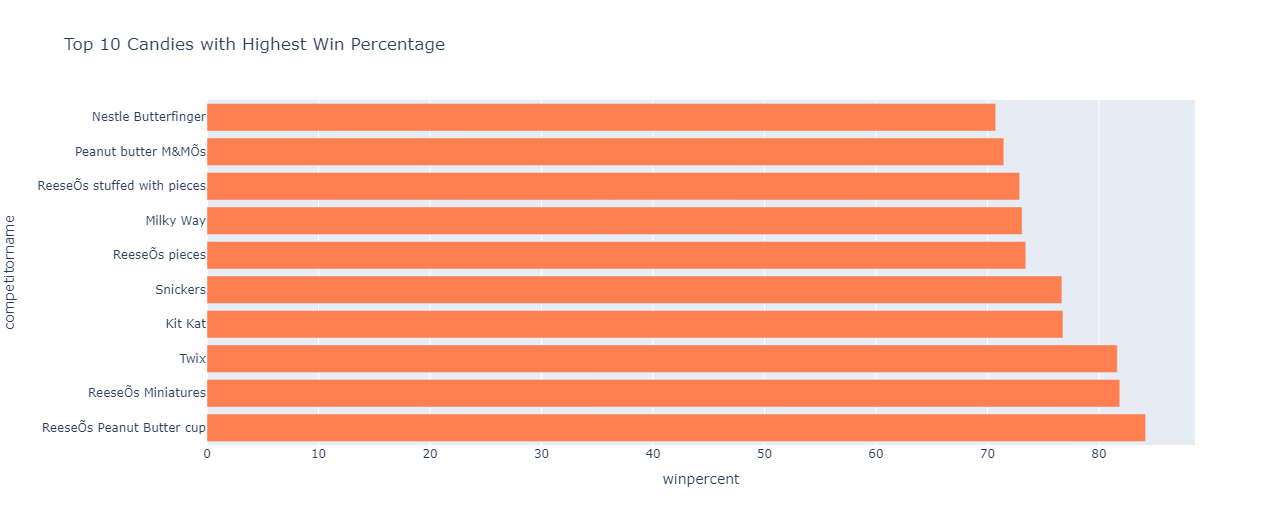
ReeseOs Peanut Butter Cup leading the charts, has the highest win percentage of 84.18029
Finding the top 10 candies with the highest sugar content:
df=df.sort_values(by=['sugarpercent'],ascending=False)
fig=px.bar(df.head(10),y="competitorname",x="sugarpercent",orientation="h",title="Top 10 Candies with Highest Sugar Percentile",color_discrete_sequence=['steelblue'])
fig.show()
The output obtained is:
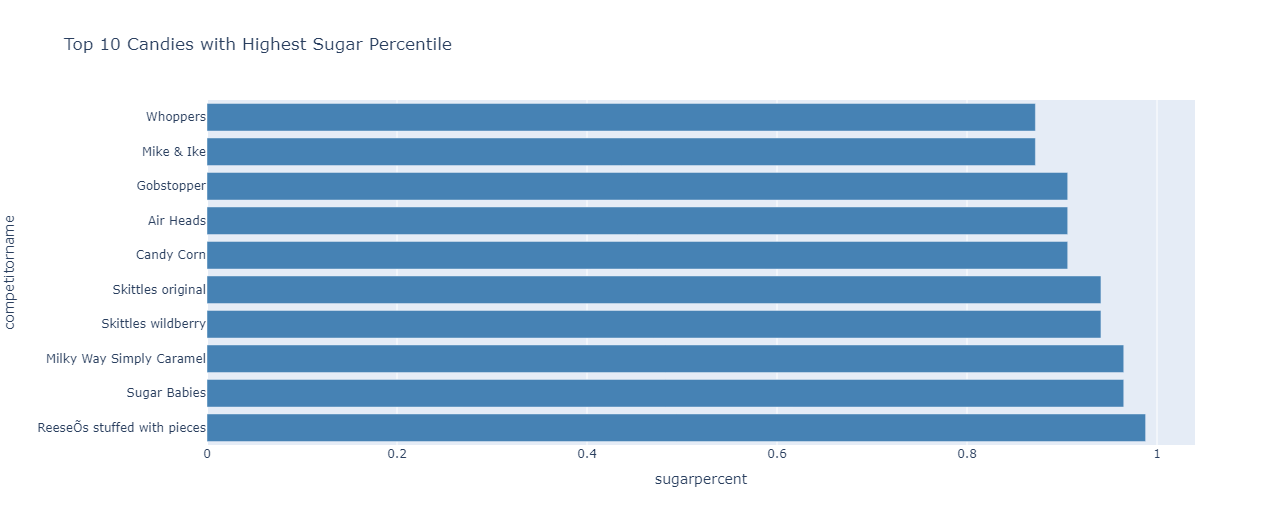
ReeseOs stuffed with pieces has the highest sugar percentile among all the candies.
Checking the top 10 most expensive candies:
df=df.sort_values(by=['pricepercent'],ascending=False)
fig=px.bar(df.head(10),y="competitorname",x="pricepercent",orientation="h",title="Top 10 Candies with Highest Price Percentile",color_discrete_sequence=['indianred'])
fig.show()
The result is:
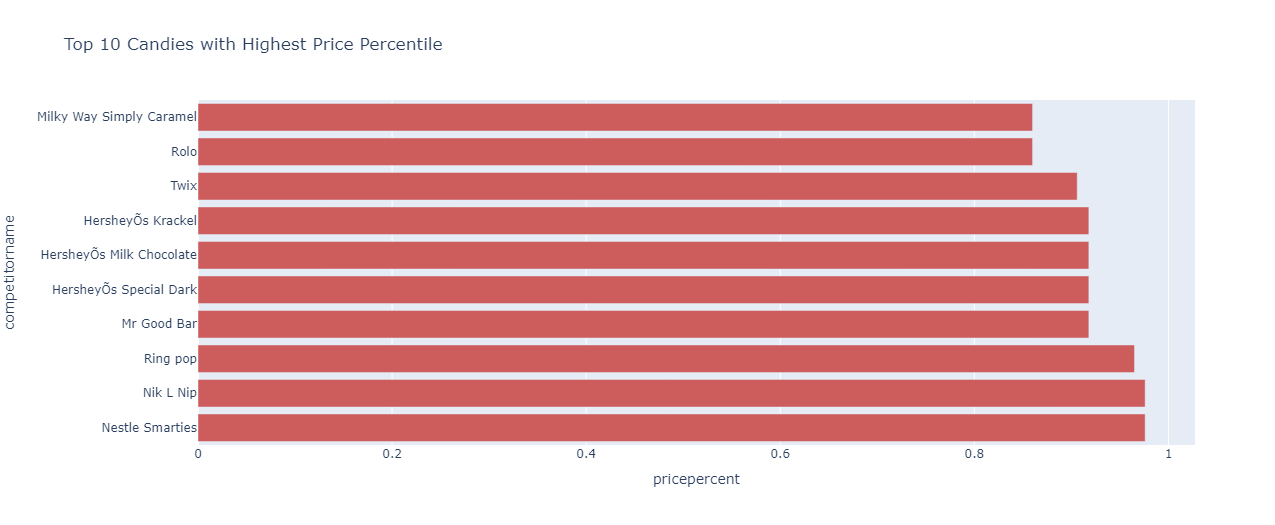
Nestle Smarties and Nik L Nip take the position as the candies having the highest price percentiles.
Determining the chocolate content in candies:
fig=px.pie(df,names="chocolate",color_discrete_sequence=[ "thistle","sandybrown"],title="percentage of candies containing chocolate")
fig.show()
The output is:
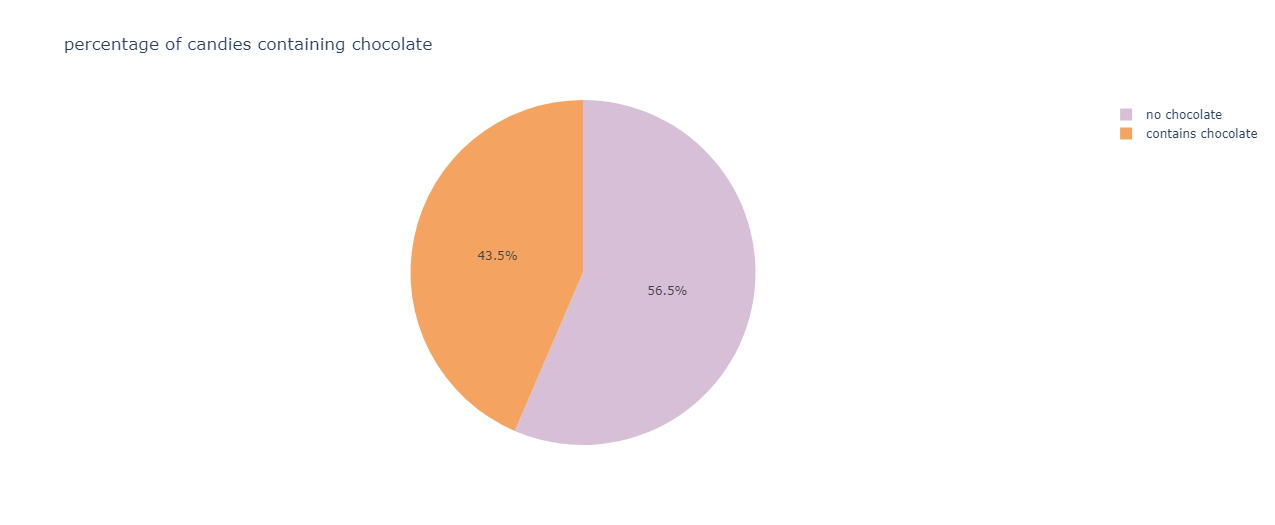
The majority of the candies do not contain chocolate.
Analysing the win percentage and sugar and price percentile by considering the presence of chocolate in candies:
fig=px.scatter(df,color='chocolate',y='sugarpercent',x='winpercent',size='pricepercent',title="Analysis of sugar percentile,win percentage and price percentile with respect to the presence of chocolate in candies",color_discrete_sequence=[ "sandybrown","thistle"])
fig.show()
The output is:
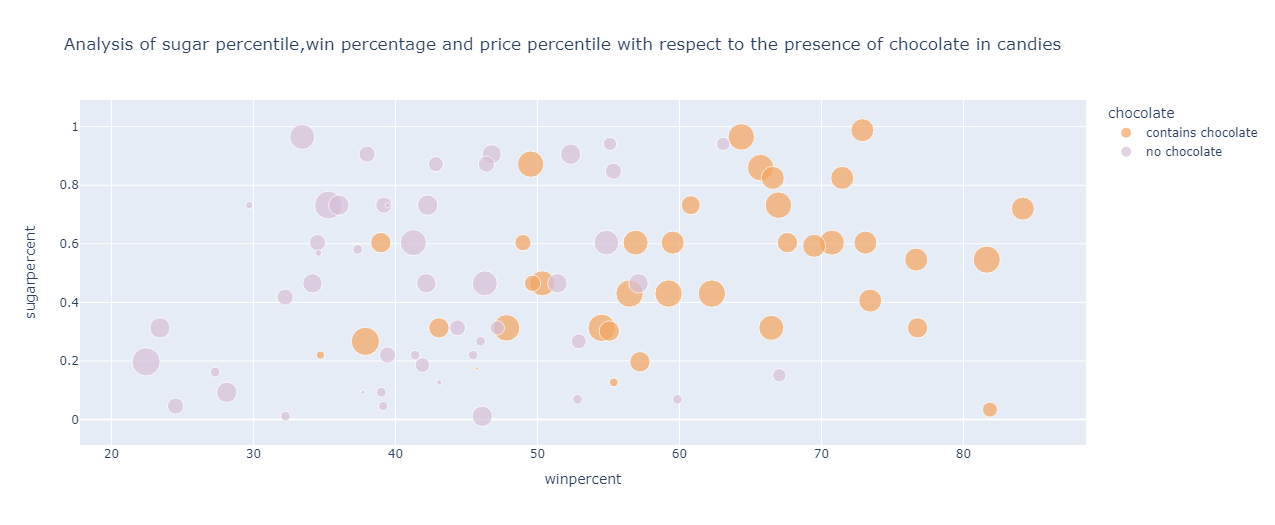
From the above graph, it can be roughly inferred that for candies containing chocolate:
Have sugar percentile ranging from 0.3 to 0.9
The win percentage is on the higher side of the spectrum
Dominated by candies that have a high price percentile
And for candies not containing chocolate, the following can be inferred:
The sugar percentile ranges from 0 to 1
The win percentage is in the range of 20% to 57%
Most of the candies in this category are of a lower price percentile
Determining the fruit content in candies:
fig=px.pie(df,names="fruity",color_discrete_sequence=[ "burlywood", "cadetblue"],title="percentage of candies containing fruit")
fig.show()
The output is:
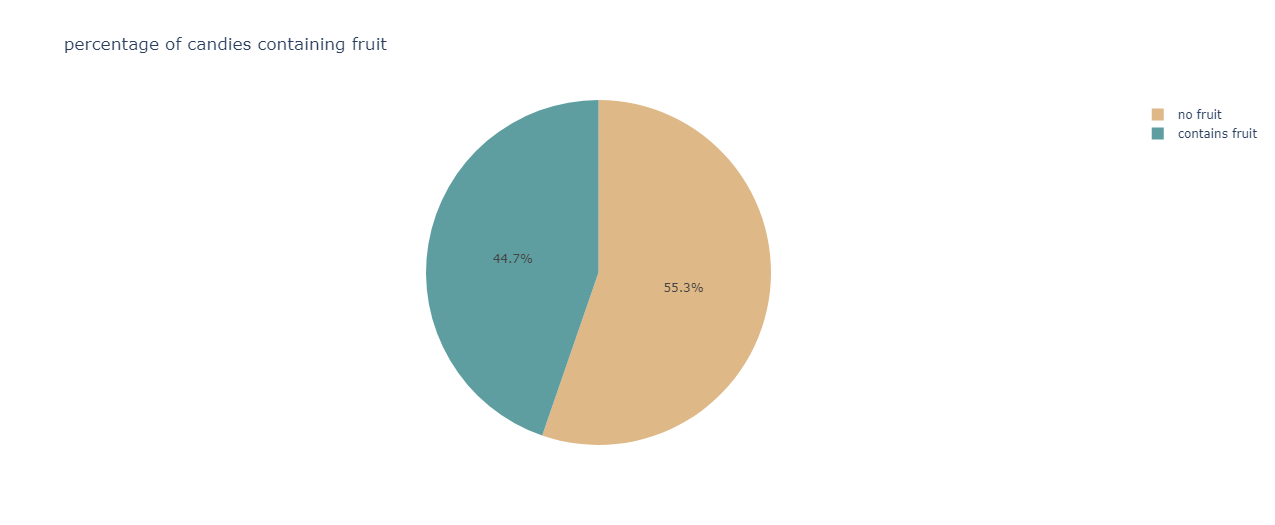
The majority of candies do not contain any fruit component.
Analysing the win percentage and sugar and price percentile by considering the presence of fruit in candies:
fig=px.scatter(df,color='fruity',y='sugarpercent',x='winpercent',size='pricepercent',title="Analysis of sugar percentile,win percentage and price percentile with respect to the presence of fruit in candies",color_discrete_sequence=["burlywood", "cadetblue"])
fig.show()
The result is:
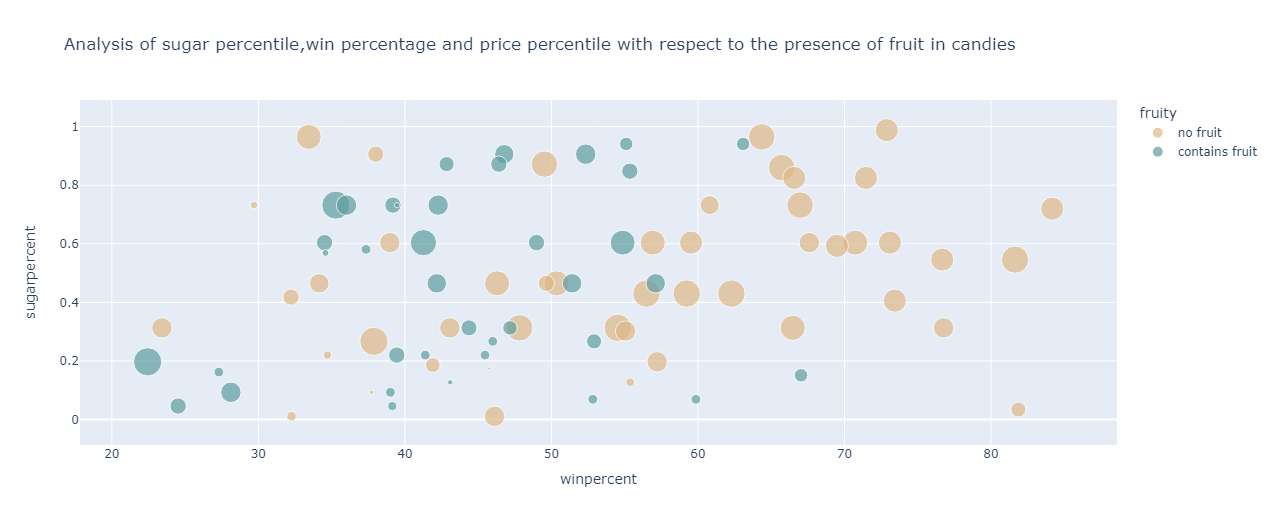
From the graph, it can be observed that for the candies containing fruit :
less expensive as compared to the candies not containing fruit
have a win percentage ranging from 20% to 57%
have the sugar percentile populated between 0.2 and 0.9
For candies devoid of fruit content, the following can be inferred:
More expensive than those candies containing fruit
Have the sugar percentile ranging from 0.3 to 1 percentile
Determining the caramel content in candies:
fig=px.pie(df,names="caramel",color_discrete_sequence=[ "burlywood", "rosybrown"],title="percentage of candies containing caramel")
fig.show()
The output is:
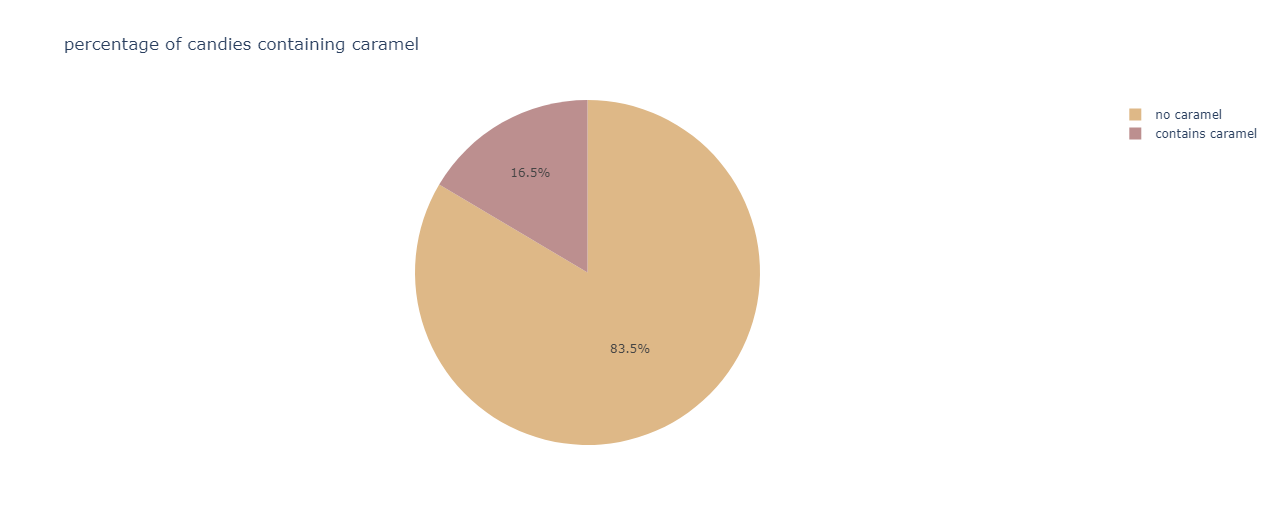
A clear dominance is shown by candies not containing caramel.
Analysing the win percentage and sugar and price percentile by considering the presence of caramel in candies:
fig=px.scatter(df,color='caramel',y='sugarpercent',x='winpercent',size='pricepercent',title="Analysis of sugar percentile,win percentage and price percentile with respect to the presence of caramel in candies",color_discrete_sequence=["burlywood", "rosybrown"])
fig.show()
The output is:
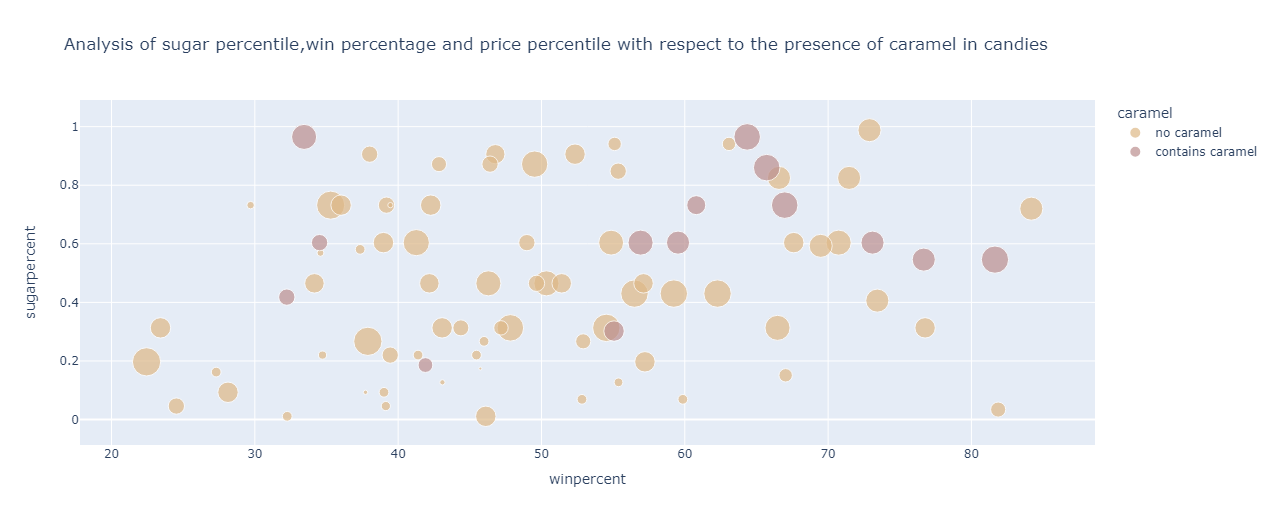
From the graph, it can be observed that for the candies containing caramel :
More expensive than those not containing caramel
The win percentage roughly ranges from 55% to 78%
The sugar percentile ranges from 0.5 to 1 percentile
For the candies devoid of caramel, the following can be inferred:
Less expensive than candies containing caramel
The win percentage ranges from 20% to 76%
The sugar percentile varies from 0 to 0.9 percentile
Determining the peanut/almond content in candies:
fig=px.pie(df,names="peanutyalmondy",color_discrete_sequence=[ "maroon", "blanchedalmond"],title="percentage of candies containing peanut and almond")
fig.show()
The result is:
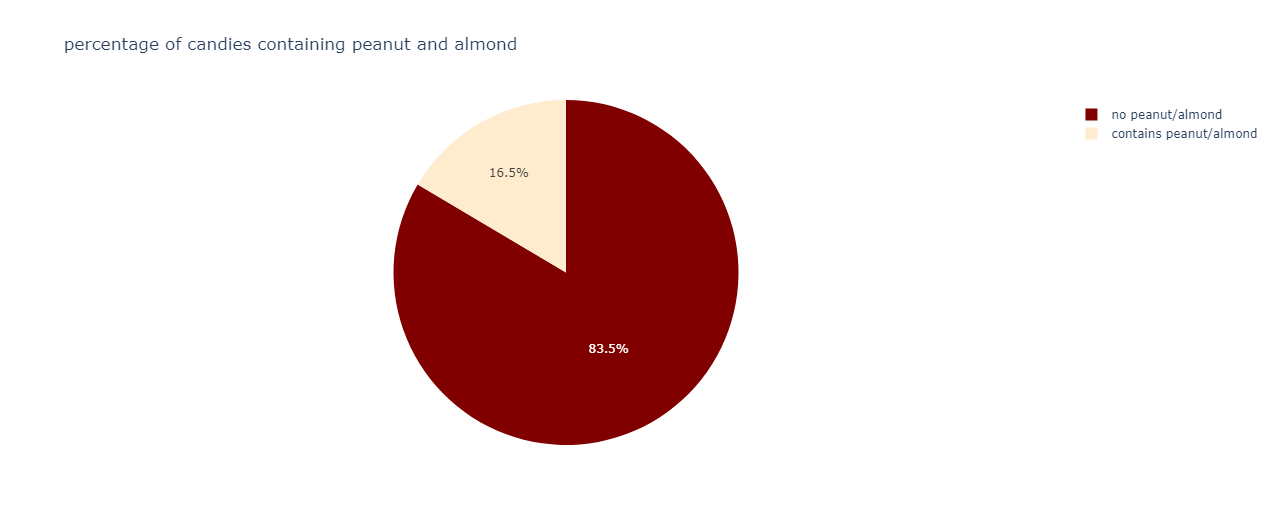
A vast amount of candies do not contain peanuts or almonds.
Analysing the win percentage and sugar and price percentile by considering the presence of peanut/almond in candies:
fig=px.scatter(df,color='peanutyalmondy',y='sugarpercent',x='winpercent',size='pricepercent',title="Analysis of sugar percentile,win percentage and price percentile with respect to the presence of peanut/almond in candies",color_discrete_sequence=[ "maroon", "blanchedalmond"])
fig.show()
The output is:
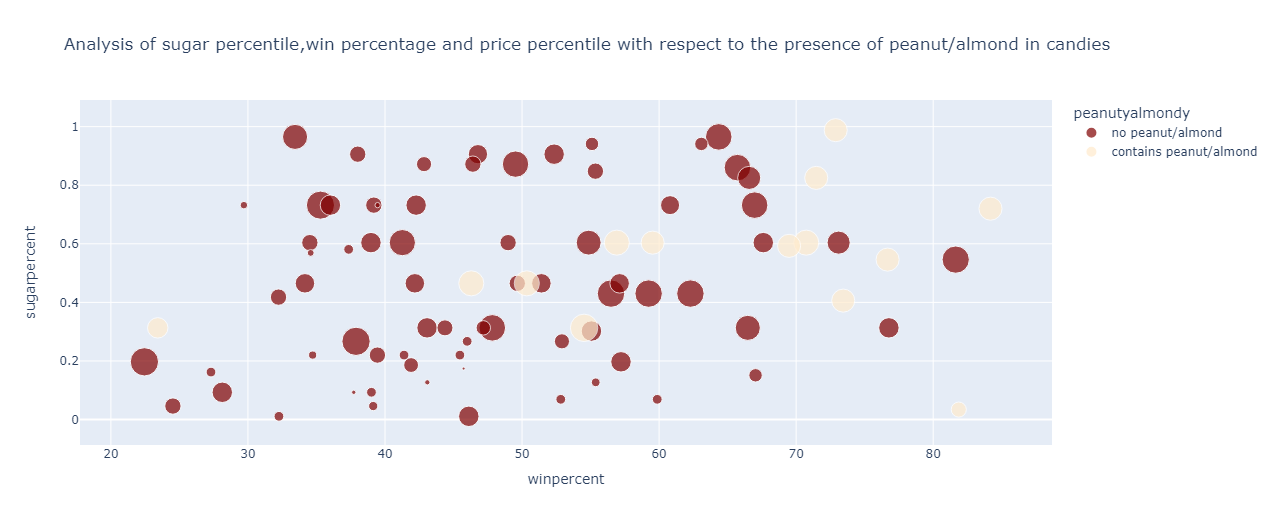
From the graph, it can be observed that for the candies containing peanuts or almonds :
Have a higher price percentile of about 0.5 to 0.65
The win percentage ranges from 46% to 77%
The sugar percentile ranges from 0.3 to 0.8 roughly
For candies devoid of peanuts and almonds, the following can be inferred:
Have a variety of price percentile
The win percentage ranges from 23% to 75% approximately
The sugar percentile is spread from 0 to 1
Determining the content of nougat in candies:
fig=px.pie(df,names="nougat",color_discrete_sequence=["darkcyan", "darkgoldenrod"],title="percentage of candies containing nougat")
fig.show()
The result is:
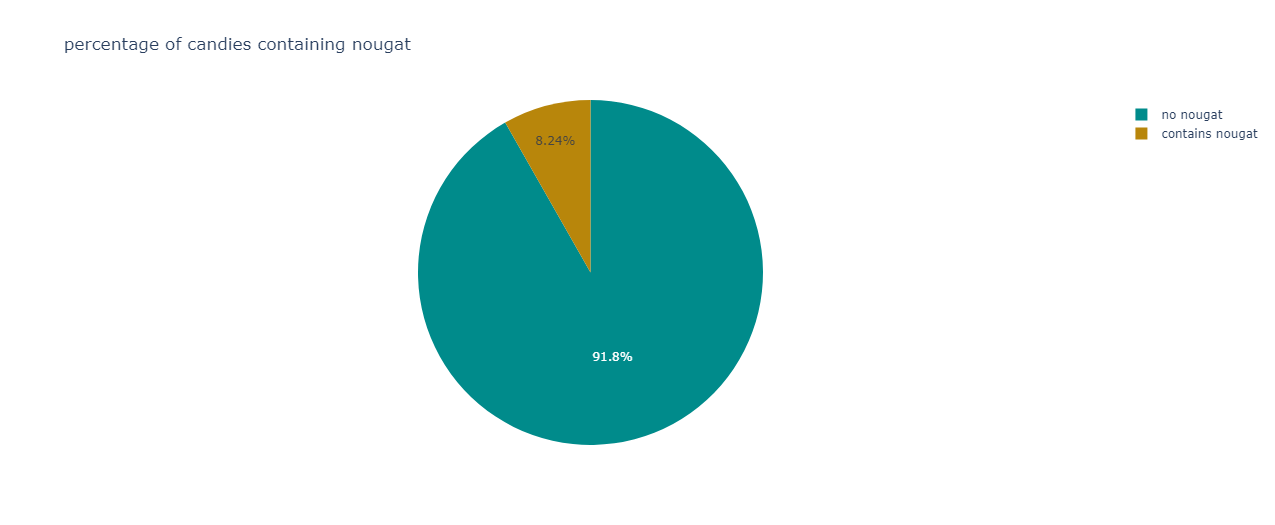
A clear supremacy is shown by candies devoid of nougat.
Analysing the win percentage and sugar and price percentile by considering the presence of nougat in candies:
fig=px.scatter(df,color='nougat',y='sugarpercent',x='winpercent',size='pricepercent',title="Analysis of sugar percentile,win percentage and price percentile with respect to the presence of nougat in candies",color_discrete_sequence=["darkcyan", "darkgoldenrod"])
fig.show()
The output is:
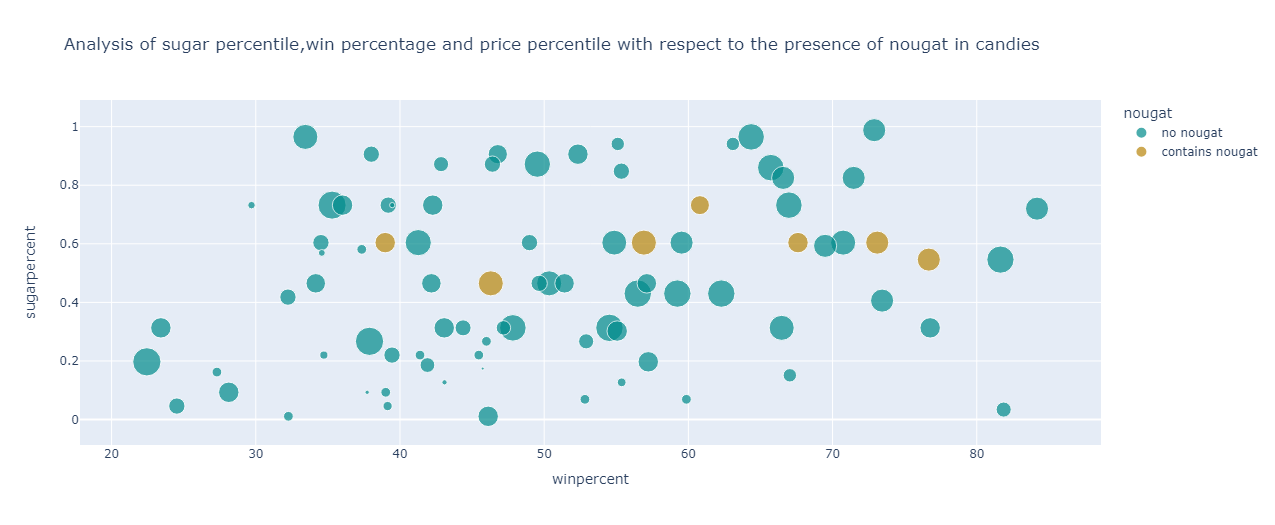
From the graph, it can be observed that for the candies containing nougat :
Have win percentage ranging from 38% to 76%
Have a restricted sugar percentile of 0.46 to 0.7
Have a mediocre price percentile of 0.44 to 0.76
For candies not containing nougat, the following points can be inferred:
The win percentage ranges from 22% to 85%
Have sugar percentile spread across 0 to 1
The price percentile of candies ranges from 0.03 to 0.97 percentile
Determining the crisped rice/wafer/cookie content in candies:
fig=px.pie(df,names="crispedricewafer",color_discrete_sequence=["lightsalmon", "blanchedalmond"],title="percentage of candies containing crisped rice/wafer/cookie")
fig.show()
The result is:
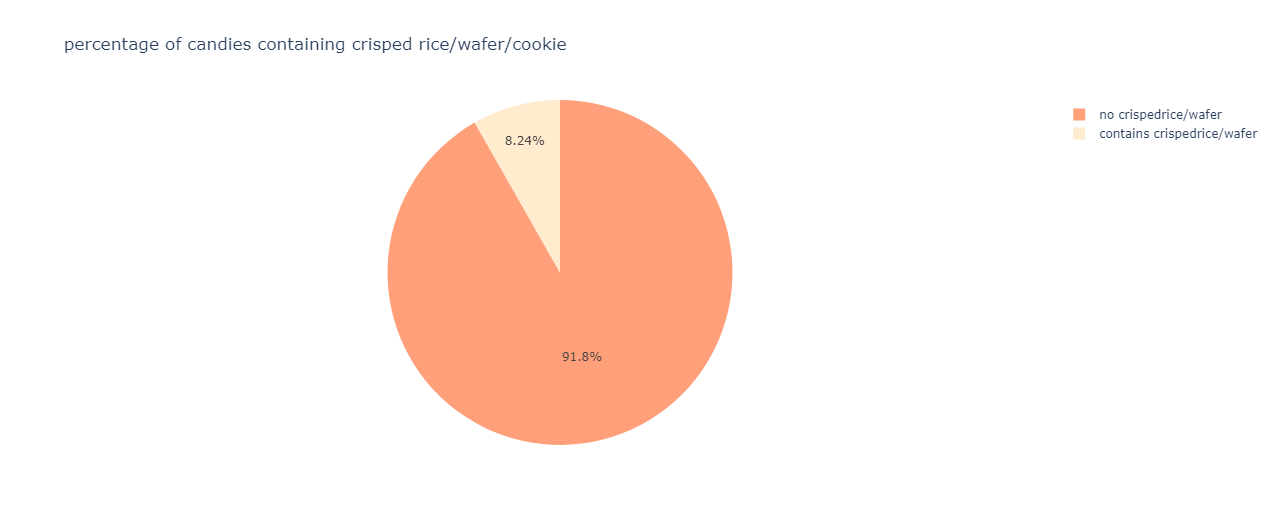
The candies without crisped rice/wafer/cookie components dominate the above chart.
Analysing the win percentage and sugar and price percentile by considering the presence of crisped rice/wafer/cookie in candies:
fig=px.scatter(df,color='crispedricewafer',y='sugarpercent',x='winpercent',size='pricepercent',title="Analysis of sugar percentile,win percentage and price percentile with respect to the presence of crisped rice/wafer/cookie in candies",color_discrete_sequence=["lightsalmon", "blanchedalmond"])
fig.show()
The result is:
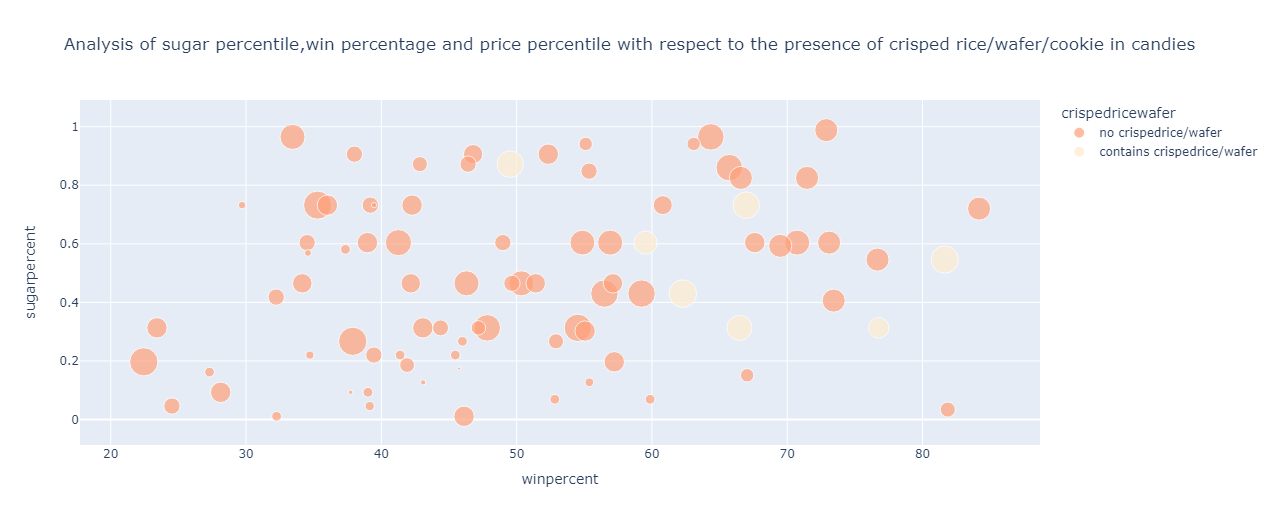
From the above graph, the following can be inferred about the candies containing crisped rice/wafer/cookie components:
The price percentile ranges from 0.51 to 0.91 percentile
The sugar percentile ranges from 0.3 to 0.84 percentile
The win percentage spans from 50 % to 81%
For candies not containing crisped rice/wafer/cookie components, the following points are observed:
The price percentile ranges from 0.02 to 0.97
The sugar percentile ranges from 0 to 1
The win percentage roughly ranges from 22 % to 84 %
Comparison of Hard and Soft Candies:
px.bar(df,x="hard",color_discrete_sequence=[ "darkslateblue"],title="Comparison of Hard and Soft Candies")
The output is:
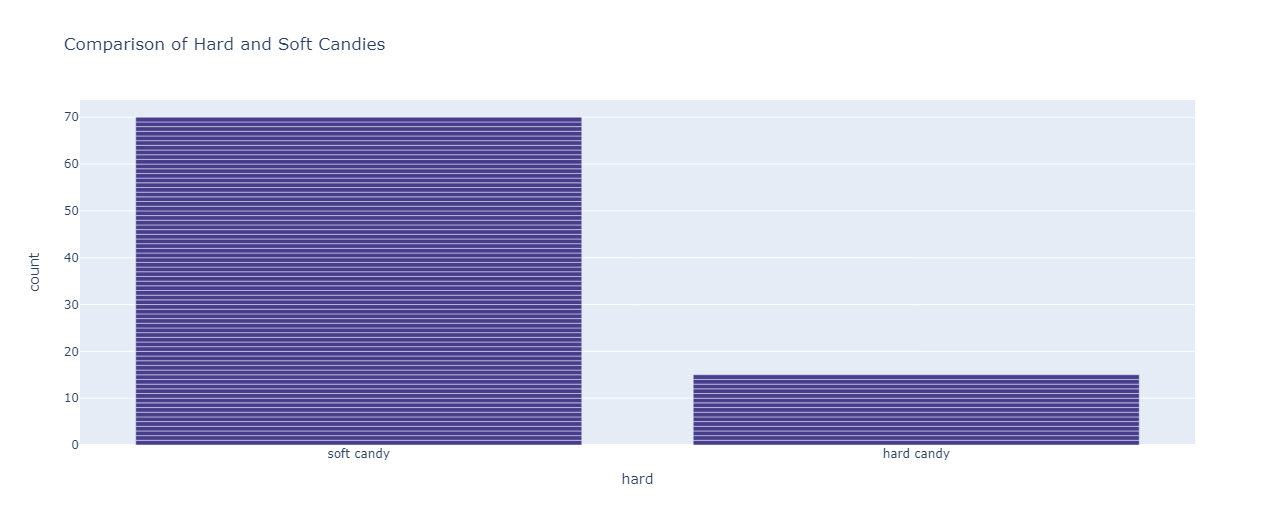
The majority of the candies are soft.
Analysing the win percentage and sugar and price percentile by considering the hardness/softness of candies:
fig=px.scatter(df,color='hard',y='sugarpercent',x='winpercent',size='pricepercent',title="Analysis of sugar percentile,win percentage and price percentile with respect to the hardness/softness in candies",color_discrete_sequence=["mediumpurple", "mediumseagreen"])
fig.show()
The result is:
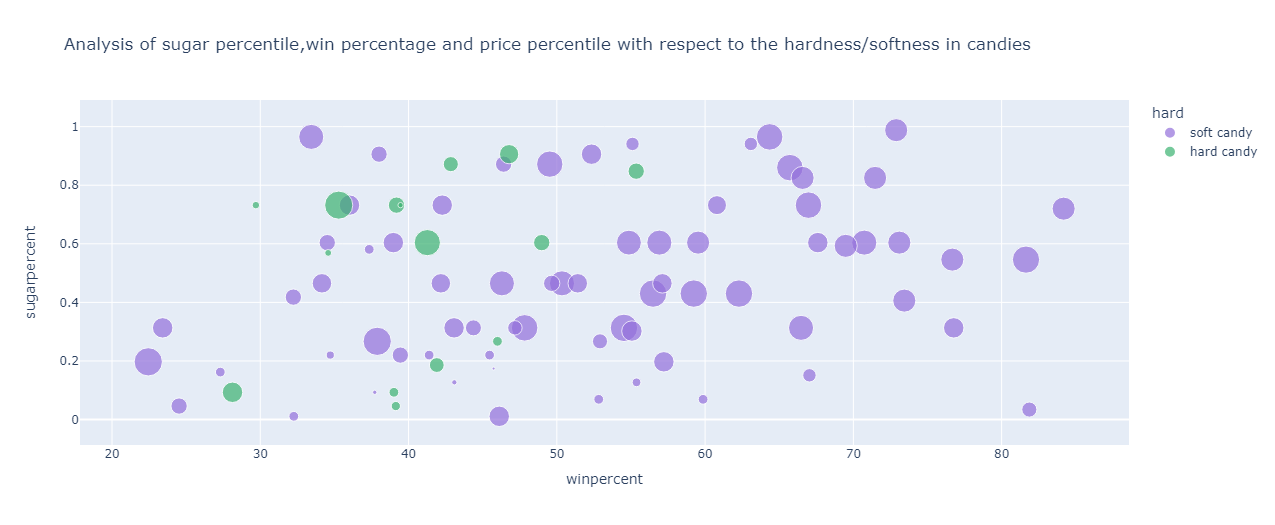
From the above graph, the following points are observed about soft candies:
Have a win percentage ranging from 22% to 84% hence they are more popular than hard candies
The sugar percentile is spread evenly from 0 to 1 percentile
The price percentile ranges from 0.02 to 0.97 percentile hence soft candies are more expensive than hard candies
For hard candies, the following points can be inferred:
Have win percentage ranging from 28% to 55%
The sugar percentile is spread evenly from 0 to 1 percentile
The price percentile ranges from 0.116 to 0.5 percentile hence they are cheaper than soft candies
Comparison of Bar and Non-Bar Candies:
px.bar(df,x="bar",color_discrete_sequence=[ "deeppink"],title="Comparison of Bar and non-Bar Candies")
The result is:
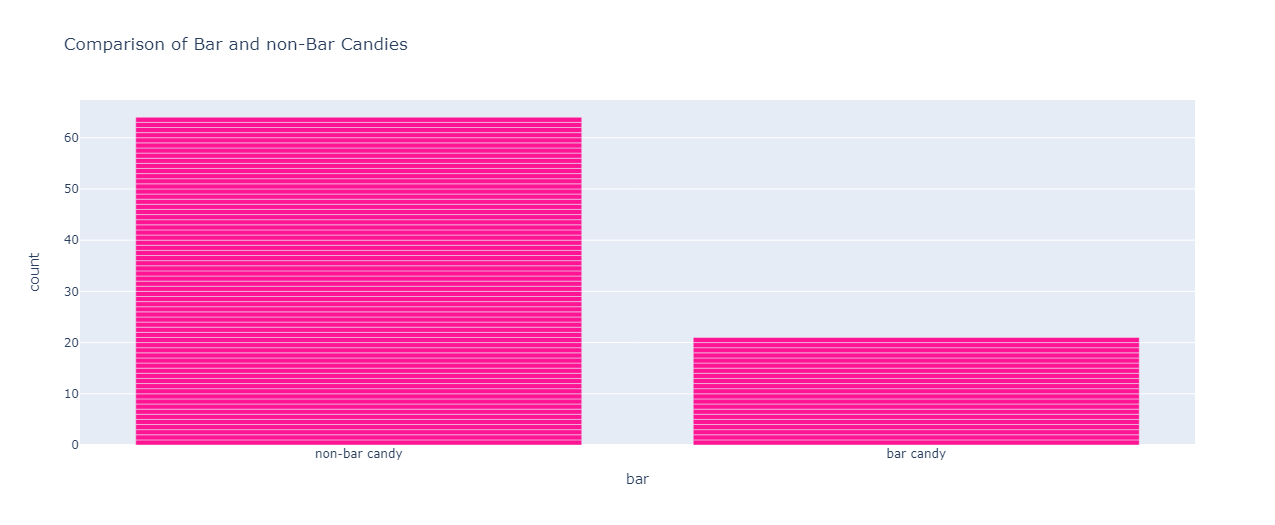
Non-bar candies dominate the dataset.
Analysing the win percentage and sugar and price percentile by considering the form(bar/non-bar) of candies:
fig=px.scatter(df,color='bar',y='sugarpercent',x='winpercent',size='pricepercent',title="Analysis of sugar percentile,win percentage and price percentile by considering form of candies(Bar/Non-Bar)",color_discrete_sequence=["olivedrab", "orange"])
fig.show()
The output is:
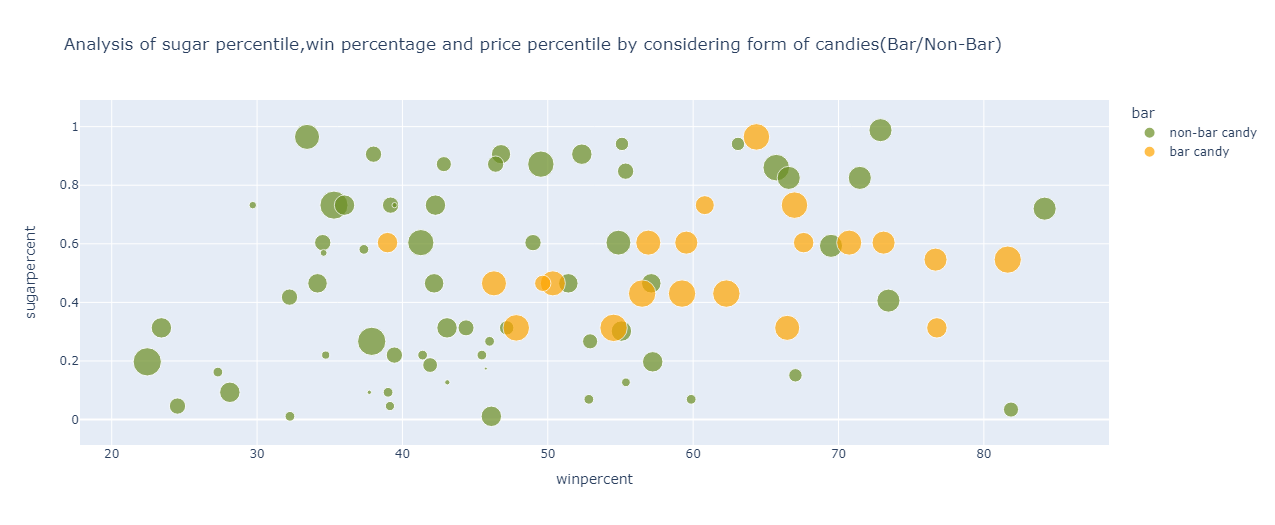
The following points are observed for bar candies:
Have a higher price percentile hence they are more expensive than non-bar candies
Have sugar percentile ranging from 0.3 to 0.8 percentile
The win percentage ranges from 46% to 77 % roughly
For the non-bar candies, the following points can be inferred:
Have a lower price percentile hence they are cheaper than bar candies
Have a sugar percentile spread across 0 to 1 percentile
The win percentage ranges from 22% to 73%
Comparison of candies in single/pack form:
px.pie(df,names="pluribus",hole=0.5,color_discrete_sequence=["peru", "pink"],title="Comparison of Candies available in single/pack form")
The result is:
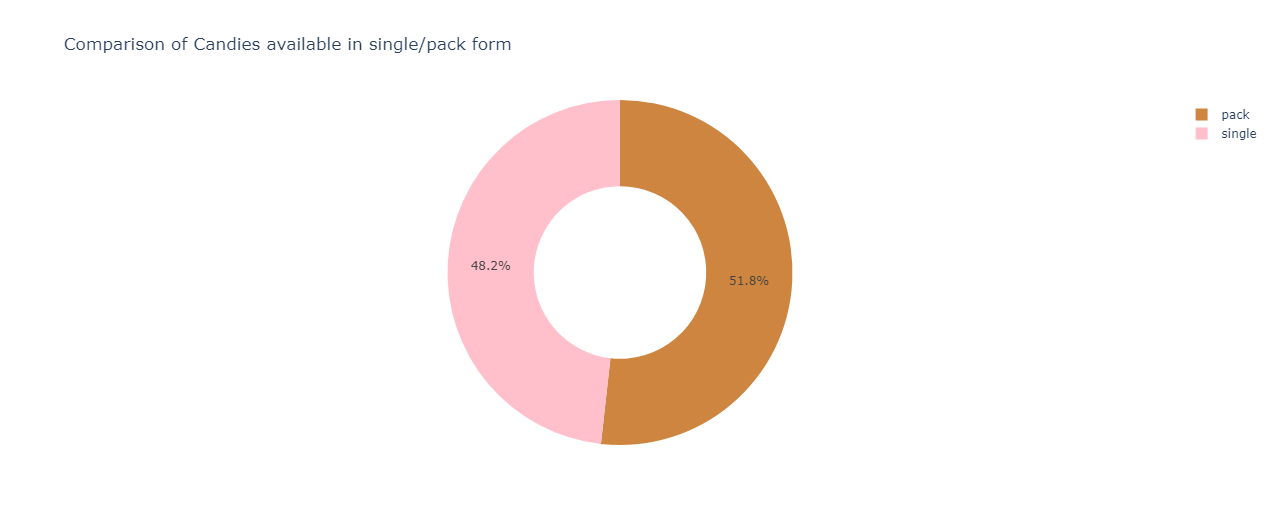
Candies that are in a pack form take a small lead over candies available as a single unit.
Analysing the win percentage and sugar and price percentile by considering the single/pack of candies:
fig=px.scatter(df,color='pluribus',y='sugarpercent',x='winpercent',size='pricepercent',title="Analysis of sugar percentile,win percentage and price percentile by considering the packing of candies(Single/Pack)",color_discrete_sequence=["peru", "pink"])
fig.show()
The result is:
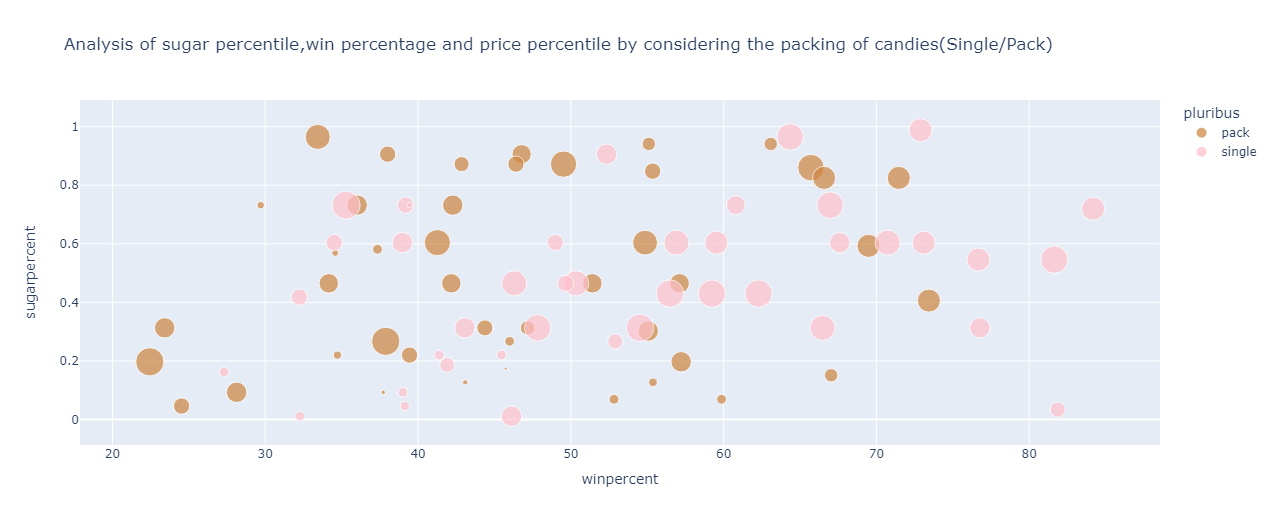
From the above graph, the following can be inferred about the candies available as a single unit:
They are more expensive than those candies available in a pack
The win percentage ranges from 27% to 84%
The sugar percentile stretches from 0 to 1 percentile
For the candies available in a pack, the following points are observed:
They are cheaper than the candies available as a single unit
The win percentage ranges from 22% to 73%
The sugar percentile stretches from 0 to 1 percentile
Found this article interesting? Give it a like and share it with your friends !!
#candy #sweet #sweettooth #sweets #dessert #food #sugar #win #treats #chocolate #candybar #hardcandy #softcandy #caramel #crispedrice #wafer #fruity #fruits #peanut #almond #nougat #data #datascience #dataanalysis #dataanlytics #python #plotly #library #pandas #visualization #graphs #graph #coding


